Intermediate D3
Objectives
-
Use D3 to calculate extreme values in a data set
-
Use D3 to scale data
-
Build scatterplots using D3 and SVG
-
Use D3 to add axes and gridlines to graphs
-
Add axis labels and titles to graphs
-
Build histograms using D3 and SVG
-
Build pie charts using D3 and SVG
Extrema and Scales
Problems Last Time
- Finding extreme values manually
- Scaling our data manually
Code Example
Code: http://bit.ly/2tzBwFC
Live Site: http://bit.ly/2uTHcKT
Extreme Values
d3.max(dataArr [, callback])
How to associate values to array elements
d3.min(dataArr [, callback])
Scales
d3.scaleLinear()
.domain([num1, num2])
.range([num3, num4])
Scales
example
1
17
-4
52
5
9
24
10
Scatter Plots
Code Example
Code: http://bit.ly/2vTC8TY
Live Site: http://bit.ly/2w9NG4E
Scatter Plot Visualization
Life Expectancy
Births per Capita
d3.extent(dataArr [, callback])
calculates min an max, returns them in an array!
var people = [
  { name: "Brett", age: 40 },
  { name: "Mackenzie", age: 30 },
  { name: "Arya", age: 78 },
  { name: "Lee", age: 22 }
];

d3.extent(people, function(d) { return d.age; });
// [ 22, 78 ]
Extreme Values
Axes and Gridlines
Code Example
Code: http://bit.ly/2wa3JzE
Live Site: http://bit.ly/2tMPGzi
Axes
50
40
30
20
10
0
60
70
80
90
100
Axes
d3.axisBottom(scale)
d3.axisLeft(scale)
d3.axisRight(scale)
d3.axisTop(scale)
Gridlines
axis.tickSize([size])
Set a new tick size
Ticks stretch in the direction of the axis
(e.g. left for axisLeft)
Gridlines
axis.tickSizeOuter([size])
Set a new tick size just for the outer ticks
Histograms
(Part 1)
Histograms
98, 53, 62, 70, 82, 38, 72, 52, 76, 58, 62, 19, 34, 54, 81, 34, 8, 91, 38, 61, 60, 5, 20, 16, 81
50
40
30
20
10
0
60
70
80
90
100
Code Example
Code: http://bit.ly/2wvwnzg
Generating a Histogram
d3.histogram()
- Returns a function
- The returned function creates bins for data passed into it
Generating a Histogram
histogram.value([value])
Specifies what value should be used when creating bins
Generating a Histogram
histogram.domain([domain])
Specifies the domain of values (i.e. the min and max) for the histogram generator
Histograms Continued
Code Example
Code: http://bit.ly/2vcN0M2
Live Site: http://bit.ly/2wwyzqq
Generating a Histogram
histogram.thresholds([value])
- Specifies how the histogram generator should separate your data into bins
- If value is an array, the thresholds will be based on the elements in the array
- If value is a number, D3 will try to make that many bins (but no guarantees!)
| num | # of bins | num | # of bins |
|---|---|---|---|
| 1 | 1 | 11 | 12 |
| 2 | 2 | 12 | 12 |
| 3 | 2 | 13 | 12 |
| 4 | 5 | 14 | 12 |
| 5 | 5 | 15 | 12 |
| 6 | 5 | 16 | 12 |
| 7 | 5 | 17 | 12 |
| 8 | 5 | 18 | 12 |
| 9 | 12 | 19 | 25 |
| 10 | 12 | 20 | 25 |
Thresholds Example
Scales Revisited
scale.ticks([count])
- Returns approximately count intermediate values from the scale's domain
- You are not guaranteed to get exactly count values!
YOUR
TURN
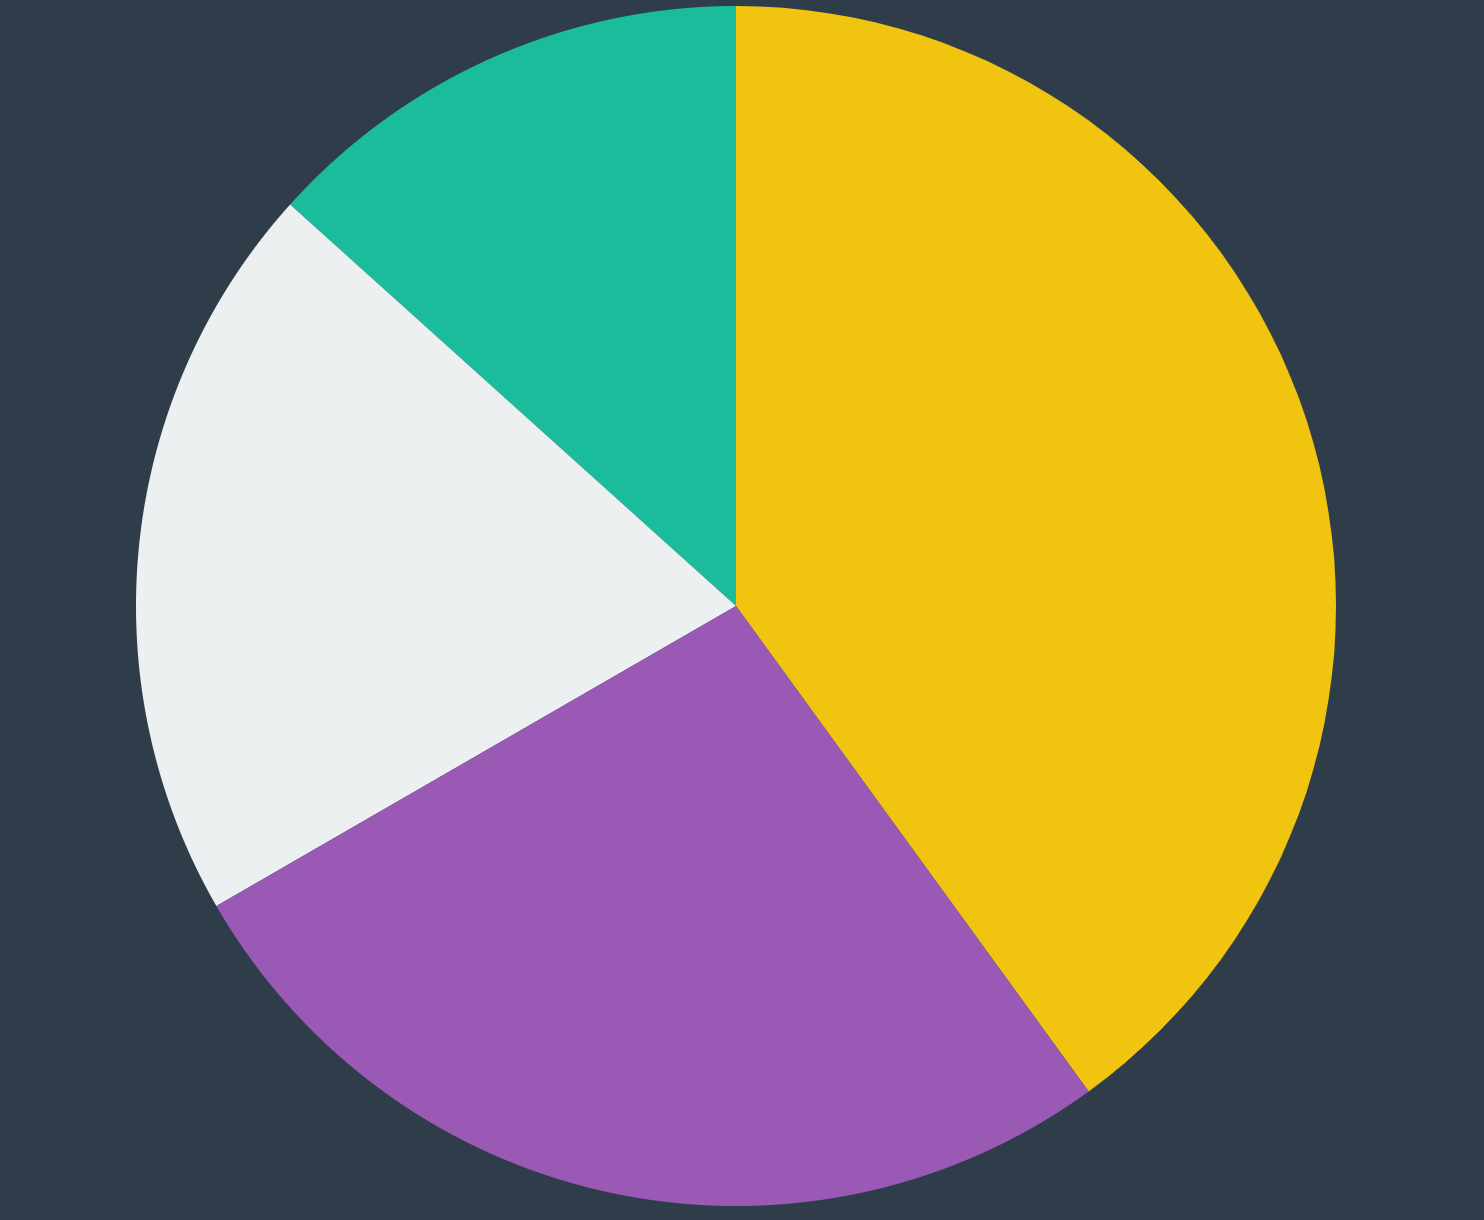
Pie Charts
Pie Charts
Arcs and SVG
<path d="M-222.94,-200.73,300,0,0,1,0,-300L0,0Z"
      fill="rgb(26, 188, 156)">
</path>
<path d="M-259.80,150A300,300,0,0,1,-222.94,-200.73L0,0Z"
      fill="rgb(236, 240, 241)"></path>
<path d="M0,-300A300,300,0,0,1,176.33,242.70L0,0Z"
      fill="rgb(241, 196, 15)">
</path>
<path d="M176.33,242.70A300,300,0,0,1,-259.80,150L0,0Z"
      fill="rgb(155, 89, 182)">
</path>
Code Example
Code: http://bit.ly/2weZpQV
Live Site: http://bit.ly/2izEcxW
Scales Revisited
d3.scaleOrdinal()
Maps a discrete set of points (e.g. [1, 2, 3]) to another discrete set of points (e.g. ['a','b','c'])
Centering SVG
SVG
Transformed g element
pie chart
pie chart
Pie Chart Helpers
{
  region: "Chile",
  continent: "SA",
  year: 1967,
  births: 259729
}
"M1.7757378587636622e-14,-290
A290,290,0,1,1,-285.4954404332191,-50.91515974483682
L-147.67005539649264,-26.335427454225943
A150,150,0,1,0,9.184850993605149e-15,-150
Z"Pie Chart Helpers
d3.pie()
- Returns a function
- The returned function transforms data
- Like d3.histogram, has a value method
Angle Measurements

2π
360°
Pie Chart Helpers
d3.arc()
Converts JavaScript objects into path commands
Arc Helpers
- arc.innerRadius([val]) - set the inner radius
- arc.outerRadius([val]) - set the outer radius
- arc.startAngle([val]) - set the start angle
- arc.endAngle([val]) - set the end angle
Examples
Pie Charts Continued
Code Example
Code: http://bit.ly/2vzgFhz
Live Site: http://bit.ly/2vswiYQ
Chart Styling Helpers
Examples
- pie.padAngle - set padding between arcs
- arc.padAngle - set padding between arcs
- arc.cornerRadius - round arc corners
Sorting Arcs
pie.sort([comparator])
- comparator(a, b) < 0: a should come before b
- comparator(a, b) > 0: a should come after b
- comparator(a, b) == 0: a and b are equivalent
YOUR
TURN
Intermediate D3
By Elie Schoppik
Intermediate D3
Intermediate D3: Scales, Axes, and Common Graph Types


